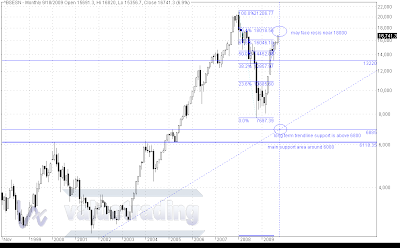
sensex long term monthly chart with various imp support lvls as shown on the chart.
 |
| RSS blog feed url: http://feeds.feedburner.com/Valuetrading |
past short term calls follow-up/performance***(stocks to watch)
date,stock,reco price,high,% gain at high
***all analysis are based on self chart study only, actual trading gains may vary.
Twitter nifty intraday trading Updates
Saturday, September 19, 2009
Thursday, September 17, 2009
some index stock charts...

acc chart, cement sector stocks are moving up now.
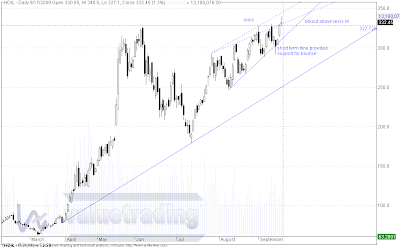
hdil chart, brkout from 327, upper resis/tgt 400 but may face intermeditae resis by upper tline as shown above.
ifci had broken out but became sluggish as its getting resisted on the upperside.
reliance brkout and swing chart.
Posted by
abhay r somkuwar
at
10:12 PM
0
comments
![]()
Wednesday, September 16, 2009
Sunday, September 13, 2009
market view: then, now and going forward...
lets rewind a bit...
from intraday ew counts we had concluded the previous short term upmove will get over around 4700 odd followed by a decline to 4580(4570 as support) or so and if not held then only a decline to 4500-4550 where again it will be a buying opportunity for next upmove to 4900 etc which will act as a good resis going forward. a nifty range chart was also put up with clearly marked brkout(4755)/down(4527)lvls. months ago we had projected dollar index to be bottoming in 75-77 range.
what has actually happened...
reaction came in below 4750 followed by downmove getting supported just above 4570, followed by upmove till just below 4900 where it got reacted again, everything just as per expectations. in between a bullish brkout from 4755 also has taken place.
also noteworthy is nifty has already retraced 61.8% of entire downmove from 6357 to 2253 and has closed above it. the us dollar index its there in projected range 75-77 already but still no sign of any reversal taking place, good for the equity mkts.
what to expect...
as said so many times before, nifty is nearing its bear mkt peak/bull mkt profit taking valuations of 22 times eps which comes to around 4900 which remained our tgt for a long time, its nearly done. technically since nifty is on a bullish brkout can go to 4970 or even 5100/5300/5500(i.e., 4700+800) as many are expecting. a touch of euphoria may be setting in.
so what to do?...
those lvls may or may not come immediately. so far, apart from the negative divergences we can see no bearishness either in nifty chart or the US or global indices incl the dollar index etc. but who knows if a reaction can come any time suddenly and sharply then what. some small profit booking can be done in medium to long term investment. the best way is to align with the uptrend and keeping a sl such as just below the intermediate support trendline for longs(including remaining portfolio cash longs), around 4600 cl basis to protect them. current support is seen near 4700 lvl.
icicibank is on a brkout, once it starts trading/closing above 835 can head towards 1000, while hdfc is on the verge of brkout from triangle. in line with mkt many stocks are maintaining the uptrend. need the mkt to be up or atleast stable for the stocks to perform in short to medium term.
(pls read the disclaimer)
Posted by
abhay r somkuwar
at
6:37 PM
2
comments
![]()
Blog Archive
-
►
2019
(2)
- ► 31 March - 7 April (1)
-
►
2017
(5)
- ► 28 May - 4 June (1)
- ► 23 April - 30 April (1)
- ► 5 March - 12 March (1)
-
►
2014
(4)
- ► 9 March - 16 March (1)
-
►
2012
(8)
- ► 20 May - 27 May (2)
- ► 13 May - 20 May (2)
- ► 6 May - 13 May (1)
- ► 29 April - 6 May (2)
-
►
2011
(42)
- ► 31 July - 7 August (1)
- ► 17 July - 24 July (1)
- ► 10 July - 17 July (1)
- ► 3 July - 10 July (1)
- ► 26 June - 3 July (2)
- ► 19 June - 26 June (2)
- ► 22 May - 29 May (1)
- ► 15 May - 22 May (1)
- ► 8 May - 15 May (1)
- ► 24 April - 1 May (1)
- ► 17 April - 24 April (2)
- ► 10 April - 17 April (2)
- ► 3 April - 10 April (3)
- ► 27 March - 3 April (3)
- ► 20 March - 27 March (1)
- ► 6 March - 13 March (2)
-
►
2010
(69)
- ► 18 July - 25 July (1)
- ► 11 July - 18 July (1)
- ► 27 June - 4 July (1)
- ► 20 June - 27 June (1)
- ► 13 June - 20 June (1)
- ► 6 June - 13 June (1)
- ► 30 May - 6 June (1)
- ► 16 May - 23 May (1)
- ► 9 May - 16 May (2)
- ► 2 May - 9 May (3)
- ► 25 April - 2 May (2)
- ► 18 April - 25 April (2)
- ► 11 April - 18 April (2)
- ► 4 April - 11 April (3)
- ► 28 March - 4 April (3)
- ► 21 March - 28 March (1)
- ► 14 March - 21 March (2)
- ► 7 March - 14 March (2)
-
▼
2009
(146)
- ► 2 August - 9 August (4)
- ► 26 July - 2 August (4)
- ► 19 July - 26 July (7)
- ► 12 July - 19 July (3)
- ► 5 July - 12 July (3)
- ► 28 June - 5 July (2)
- ► 21 June - 28 June (3)
- ► 14 June - 21 June (3)
- ► 7 June - 14 June (2)
- ► 31 May - 7 June (2)
- ► 24 May - 31 May (1)
- ► 17 May - 24 May (4)
- ► 10 May - 17 May (6)
- ► 3 May - 10 May (4)
- ► 26 April - 3 May (1)
- ► 19 April - 26 April (2)
- ► 12 April - 19 April (2)
- ► 5 April - 12 April (3)
- ► 29 March - 5 April (3)
- ► 22 March - 29 March (4)
- ► 15 March - 22 March (2)
- ► 8 March - 15 March (4)
- ► 1 March - 8 March (4)
-
►
2008
(108)
- ► 27 July - 3 August (2)
- ► 22 June - 29 June (2)
- ► 15 June - 22 June (2)
- ► 8 June - 15 June (3)
- ► 1 June - 8 June (3)
- ► 25 May - 1 June (1)
- ► 18 May - 25 May (2)
- ► 11 May - 18 May (3)
- ► 4 May - 11 May (1)
- ► 20 April - 27 April (2)
- ► 9 March - 16 March (1)
-
►
2007
(92)
- ► 29 July - 5 August (9)
- ► 22 July - 29 July (2)


