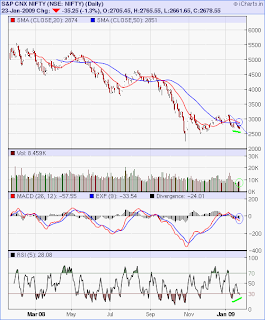
 nifty futures chart.
 nifty chart shows although price is downtrending and bearish on macd, it shows positive rsi divergence and falling on low volumes now but getting resisted by the falling trendline(a falling wedge-type pattern).
 so a bounce is due and any short term upmove, if comes, may get resisted by the previous support trendline and converging moving averages which are currently near 2875. immediate downside may be limited near 2600. nifty support is 2525.


No comments:
Post a Comment